Beyond “know your number.”

Do you know your number? When did you find it out? What has it meant to your life since you found it out? 

You may be wondering precisely which number I’m talking about, and why it should have such importance. That’s a fair question. 

Across our electricity usage and options, budget for retirement, or greenhouse gas emissions, we are encouraged to know what our personal (or business) number might be. Knowing your number often intended as a form of empowerment. It’s reasonable to ask, “is this helpful?” and “is this sufficient?” 

The number I’m thinking about today is the greenhouse gas footprint for a farming operation, the target of a campaign that New Zealand farming industry group, He Waka Eke Noa, ran in 2021-2023. The point was to give farmers a handle on the emissions from their farming operations, and several calculators were developed and promoted to achieve this outcome. 

Is knowing a farm’s greenhouse gas emissions number helpful? 

The saying “Knowledge is power” is often attributed to Sir Francis Bacon, who aside from having a fantastic last name, wrote “Nam et ipsa scientia potestas est” or “Knowledge is itself power” (Meditationes sacrae, 1597). His point was that there is as much power in knowledge as in doing things.  

We use this phrase today to imply that the power of knowledge is that it gives us options and enables us to choose our actions. Instead of doing what we have always done, we can choose our priorities or path. 

There is a sense in which knowing our number can be helpful. Benchmarks help us to understand how we compare with others in our region or internationally, typically using some intensity metric such as emissions per kilogram of milk solids or meat, or per hectare or per head. 

More useful is the breakdown of emissions and warming potential by activity. This can help us understand the relative contributions to warming of our electricity use, the nitrogen in fertilisers, and the methane from ruminant animals. 

At the same time, numbers by themselves are not sufficient. They can help us understand the gap or opportunity, but a number rarely provides long-term motivation to change. Even if the motivation is there (and most farmers I’ve met want to be contributors and not laggards), a number by itself is not a plan.  

In our experience helping agri-food supply chains and finance businesses to monitor emissions, what farmers and their value chain partners seek are: 

  • Using benchmarks and activity breakdowns to understand the gaps and opportunities that are relevant to each farm system and business. 
  • Identifying potential abatement or mitigation options for reducing absolute emissions or emissions intensity. 
  • Weighing up the local environment and team practicality and financial or capital implications of the options and forming a plan and budget. 
  • Monitoring progress against the plan and adapting as needed. 

We focus our efforts on helping farmers and value chain organisations such as processors, brand-owners, and financial institutions to connect the data that provides evidence for sustainability, and this often includes greenhouse gas emissions. We’re agnostic about which calculator our customers select, though if I’m asked, I provide some guiding questions: 

  • Does the calculator you’re considering align with current IPCC methodology, work at an appropriate tier for farm businesses, and support local emissions factors? 
  • Can we populate data into and out of the calculator, so that farm-scale activity data drives calculations, and the results can be benchmarked? 
  • Will it support identification and analysis of options for reducing emissions or emissions intensity? If so, is this something that the farmer can drive, or do they need an advisor? Using an advisor can often be great, especially if they bring deep understanding and real-world experience. 
  • Is there room (in the calculator or elsewhere) to track activities, efficiency improvements, and other changes, and see progress? 

Just knowing your number – while disconnected of decision making – doesn’t deliver the power and benefits that farmers and supply chains seek. Add benchmarking and context to help understanding, and it can become helpful. If you can provide tools and options to identify levers for change, and help with the planning and tracking, then there is power indeed. 

And as Voltaire (1694-1778), Winston Churchill, and Peter Parker would say “With great power comes great responsibility.” 

Let’s use those insights prudently. 

Streamlining Agrifood Emissions

How are food and fibre value chains tackling the greenhouse gas emissions from agriculture, and monitoring improvements?


Andrew Cooke and Scott McKinnon hosted a fascinating webinar, bringing expert insights from Merri King, Sustainable Sourcing Manager for McDonald’s Australia & New Zealand, and Simon Love, Head of Sustainability Assurance for AsureQuality in New Zealand.  

Over the hour, our speakers discussed key challenges that face them, but also, how they’re working towards solving the big issues for them, and the planet.  

McDonald’s is the first global restaurant company to take on SBTi targets at scale, and Merri King took us through their objectives and approach. One thing that’s become clear is the need to support knowledgesharing among producers across the globe, and ensuring the right methodology and practices are implemented for reliable measuring of baselines and changes. McDonald’s is experimenting with several tools to help producers, supply chain participants, and McDonald’s to better understand the impact of the decisions made throughout their supply chain.  

AsureQuality’s Simon Love explained the emissions reporting challenges, highlighting how standardisation and data sharing will be a key accelerant for tackling climate action.  

“Measurement, mitigation, and adaptation are just some of the parts that go into building a transparent sustainability strategy”, explained Simon, also touching on how this may vary by industry, and where adaption may be growing.  

Simon walked us through how businesses level up the data they collect for reporting, moving from benchmark averages, towards a fully integrated data future.  

Closing the presentations, Andrew Cooke, Chief Technology Officer at Map of Ag, explored the methods that businesses are using to support greenhouse gas emissions Measurement, Reporting, and Verification (MRV). There are several main approaches with different benefits and weaknesses. Andrew demonstrated how Map of Ag applies the theory and integrates with activity and inventory data from source to provide all stakeholders with a greater understanding of farm systems, emissions profiles, and opportunities.   

Audience members had a range of questionscovering soil health and carbon, deforestation, processes, farmer engagement and the cost of compliance. You may find the answers and discussions from the panel address issues on your mind too. 

You can watch this webinar by clicking here.

Don’t just use your data once

If you’ve read some of my work in the past, you’ll know that I often write about farm or agricultural data, and that I have a particular point of view on reusability of information captured on farms, or even built up remotely, about farming systems. Why is that?


I’m not a farmer, though I’ve had the privilege of working closely with some farmers through my career, and at a distance with many more. If you’re a farmer or grower, or you are working with those who are, here are some reasons to pay attention to how information is captured, and how you might get the best mileage out of it.

Let me tell you a parable about a fig tree (I know – that’s been done before).

A large fig tree grows outside my house. It’s called “brown turkey”, and it has green figs in spring, and especially in autumn, which turn a purply-brown as they ripen. The tree is large, and tall, which means the birds, especially the tiny Tauhou or silvereye, get to eat their fill each autumn.

My wife and I watch the birds eat the fruit, and sometimes we wish we could beat them to it. Sometimes I have reached up to pick a ripe fig, only to discover it is a mere shell of a fig. The birds have eaten the entire fruit, leaving only the skin.

If we really wanted to, we could beat the birds. We could prune the tree to a reasonable size, cover it with bird mesh, use bird scarers, and harvest all the fruit ourselves. But what would we possibly do with all that fruit?

This is the first lesson of agricultural data. The range of remote sensing, sensor, wearable and device data is vast. Some data will be valuable to your operation. Trying to harvest all that data right now, without a good sense of how you will get value from it, is like me trying to harvest all the figs – expensive, pointless, and best left for the birds.

My wife loves to eat fresh figs. When we do manage to get some figs for ourselves, she picks several of the ripest ones and enjoys them straight away. In fact, her love for figs is probably the reason my father-in-law gifted us the fig seedling in the first place.

For many farmers and growers, the first use of their data should rightfully be to inform their own decisions. It’s the soil test that informs nitrogen application for a vegetable crop, or the livestock weights and weight gain that helps with drafting or sorting decisions. This first use of data is why many farmers invest in sampling, testing, or measuring technologies in the first place.

I would be terribly disappointed if our use of figs stopped at just that first use.

I love our figs for what they can become. A fig chutney that goes perfectly with good cheese. Blended with stewed apple to turn an applesauce cake into an amazing fig cake. Served with cured meats. The list goes on.

If you’re a farmer or grower, these are the later uses of the data you collect on farm. It might be the insights you gain from participation in benchmarking or catchment group discussions led by a farm advisor or agronomist. Or you may use the data you collect with your customer or supply chain, to show evidence that your operational practices make the grade for sustainability, welfare, and carbon requirements. It might support your future planning and bank finance requirements. The list goes on.

There’s one thing that I don’t like doing with figs.

I don’t like picking figs, and then leaving them on the bench to wither or rot. Unlike some of the fruits we love, figs have a truly short shelf life. Use it or lose it. And if we do end up throwing out rotten figs, sometimes we must buy or find poor substitutes in all those other uses.

Sadly, it can be the same with data collected on farms. If the livestock weights never made it out of the weigh scale, will they be useful when you want to look at trends next season? If your only record of fertiliser or feed inputs are on paper receipts in the filing cabinet, the process of filling in an annual carbon footprint return will be frustrating and you’ll resort to guesswork.

Just as I’m best to ensure any figs that are not eaten fresh are at least sliced and frozen for later reuse, for those who farm as a business, it’s worth at least a small amount of investment to ensure your data is in a state that can be retrieved and reused when you need it. Next purchase or renewal, it’s worth asking your technology provider how you can be sure your data will be available and easy to use in future recipes – er, analyses.

Growing Greener Together: Map of Ag and ADM’s Regenerative Agriculture Partnership

The imperative for sustainable practices has never been more urgent. Recognising this, ADM, a global leader in nutrition and agricultural origination and processing company, is pioneering climate-smart agriculture initiatives in the UK with support from Map of Ag. Through this collaboration, both companies aim to promote regenerative agricultural practices and build a more resilient and sustainable food system.


Aims and Initiatives:

Allie Hesketh, Climate Smart Coordinator at ADM, emphasises the goal of ADM’s Regenerative Agriculture programme: “Our aim is to help transition UK agriculture to a more regenerative approach to food production by providing financial and technical support to farmers who are taking positive steps to reduce their carbon footprint, improve water quality, and promote soil health and biodiversity through the implementation of regenerative agriculture practices.”

ADM’s initiative has gained traction since its inception. Initially launched in North America, the programme has seen remarkable success, enrolling over 1 million acres by 2022. Building on this momentum, ADM expanded its reach to Europe, focusing on the UK and Poland. In the UK, ADM Agriculture launched its programme in September 2023, offering incentives to growers across their oilseed rape and part of their milling wheat supply chains for implementing regenerative practices such as conservation tillage and companion cropping.

Map of Ag supports the project by verifying actions undertaken and facilitating data collection and analysis to assess greenhouse gas emissions, biodiversity scores and in-field carbon sequestration as a farm performance indicator, alongside other key metrics across participating farms.

“We help remove duplication, by ingesting data from farm management software via our Pure Farming platform.” says Anna Powell, Sales Consultant at Map of Ag.

Solutions offered by Map of Ag to support the ADM regenerative agriculture project, including technical support from experienced sustainability teams and leveraging satellite verification technology to validate actions.

Integration of Sustainability into Business Strategy:

“Sustainability is at the heart of what we do,” states Allie Hesketh. “In our 2022 global sustainability report, we reaffirmed our commitment to sustainability as a foundation of our purpose and a pillar of our growth strategy.”

This commitment permeates every level of ADM, from top leadership down to individual employees. CEO Juan Luciano’s unwavering support underscores the importance of sustainability for long-term growth and resilience.

Collaborative Efforts to Overcome Challenges:

Allie Hesketh identifies a key challenge: “The market is developing rapidly to support lower carbon and more regenerative agricultural practices, and we need to close the gap between engaged and disengaged stakeholders.”

To address this, ADM’s programme remains agile and responsive, supporting farmers in transitioning to regenerative practices while aligning with customer demands. By providing support and incentives, ADM aims to drive positive change within the industry.

“Growers are notoriously busy, so engagement can be a challenge.” Anna Powell acknowledges.

Emphasising the collaborative efforts between Map of Ag and ADM in supporting growers with data sharing and engagement. By providing valuable insights and performance metrics, such as carbon emissions and yield, growers are empowered to monitor their progress and benchmark their performance. This collaborative approach has been instrumental in fostering grower engagement and driving positive outcomes and the knowledge and insight provided dovetails in to the programme’s additional technical support provided to growers, helping them overcome barriers on farm and ensuring the supply chain and growers address these industry wide challenges together.

Future Outlook and Expansion Plans:

Looking ahead, ADM is committed to scaling up its sustainability initiatives. Allie Hesketh notes, “We have the opportunity to help create value for farmers and customers across the range of crops we source while working to reduce the industry’s environmental footprint.”

Leveraging their experience, ADM aims to expand their programme, engaging more farmers and customers to drive widespread adoption of regenerative agriculture practices.

“Precision remote sensing technology is developing at pace,” Anna Powell reflects.

Highlighting the importance of specificity in verification requests to ensure clarity for growers. Looking ahead, Map of Ag aims to explore more precision remote sensing capabilities and integrate farm software as a backbone for data inputs and verification processes, thus enhancing efficiency and accuracy.

Through collaborative efforts, these industry leaders are driving positive change within the agricultural sector and contributing to broader environmental conservation efforts. As the world grapples with pressing environmental challenges, initiatives like ADM’s Regenerative Agriculture programme offer a glimpse of a more sustainable future—one where agriculture serves as a catalyst for positive change.

Beyond Baselining

It is pretty clear now that understanding and addressing greenhouse gas (GHG) emissions at farm level is imperative for sustainable food production and combating climate change. In this blog post I want to discuss three points; what challenges are we addressing now? What is the path to move forward? And a silent issue that has not yet fully surfaced…


Firstly, establishing baselines for agricultural GHG footprints serves as a foundation for implementing effective abatement strategies. Let’s delve into the importance of baselines and explore key considerations when developing and implementing mitigation measures.

Baselines provide a benchmark for measuring current GHG emissions in agriculture, enabling stakeholders to track progress and set reduction targets. It allows supply chain businesses to benchmark their suppliers and identify best practice to share across their producer base. At the farm level establishing a baseline helps identify emission hotspots, prioritise mitigation efforts, and monitor the effectiveness of interventions over time.

In talking to agrifood businesses over the last 18 months, the discussion has been about how to gather data for modelling, which model is best, and what systems should be used. Businesses are trying to sort the weeds from the crop and work with models and partners that support industry standards. In the more recent months, the discussion has already started to swing around to how to identify, recommend and implement abatement at the farm level, to start to meet industry targets for reduction.

Secondly, an emerging talking point is that implementing abatement strategies to reduce agricultural GHG emissions may incur cost and will affect the farms productivity. Assessing the cost-effectiveness of mitigation measures is crucial to ensure that investments yield positive environmental outcomes without compromising economic viability. Being able to include gross margin in scenario planning is a key and will be much more difficult to model, as it will be individual at the farm gate.

The third silent challenge at the back of peoples minds is that implementing abatement strategies often requires changes in farm management practices. It is great that there may be clear strategies a producer can adopt, but this doesn’t necessarily mean these options fit their business model or are practical for them to implement. Three key challenges in changing practices include:

  • Adopting new skills, potential ethical considerations, and managing the associated risks. Farmers may need to learn new skills, undertake specialist training, and seek external support to implement sustainable practices effectively.
  • Potential abatement options may not align with the individuals ethical approach to agriculture or align to the business risk profile. This may make the implementation of the solution uncomfortable from a personal and /or business perspective and limit or slow the effectiveness of the abatement.
  • The environmental practicality of the option may not suit the region or farm system. Considerations must guide the selection of abatement strategies to ensure that interventions align with broader farm environment. Factors such as water use & availability, existing and future biodiversity, soil health, species, and variety selection for both regenerative practice or crop changes will vary greatly.

In conclusion, baselines for agricultural GHG footprints provide a crucial starting point for developing and implementing effective abatement strategies in the farming sector. Consideration of factors such as cost-effectiveness, productivity impacts, management changes, and broader environmental realities are real and will affect individual approaches.  Early collaboration among farmers, policymakers, researchers, and industry stakeholders is essential for driving innovation and achieving meaningful reductions in agricultural GHG emissions. We are in the early days of the journey, however it will be a quick ride over the next few years.

Map of Ag Attains Certification Under Farm Data Principles Scheme

Map of Ag proudly announces its certification under the innovative Farm Data Principles scheme. This certification, administered by Farm Data Principles Ltd, signifies Map of Ag’s dedication to upholding the highest standards of data care, security, and ownership within the British food and farming industry.


Established in 2023, Farm Data Principles Ltd, a not-for-profit organisation, emerged from the former British Farm Data Council’s legacy. This certification scheme, overseen by council members, aims to foster trust in data sharing while safeguarding farmers’ interests.

The Farm Data Principles certification scheme is governed by clear and robust principles, ensuring that data originators, primarily farmers, retain control and ownership over their data. Under this scheme, Map of Ag commits to:

  • Recognising and respecting that farmers own and control their data.
  • Providing farmers with easy access to edit, delete, and migrate their data.
  • Obtaining explicit opt-in permission before accessing, storing, sharing, or selling any data.
  • Maintaining transparency regarding data processing parties and purposes.
  • Demonstrating the value and benefits of data sharing through monetary and actionable insights.
  • Adhering to stringent data security standards and protocols.
  • Facilitating seamless data sharing through simplified naming conventions and interoperable systems.
  • Offering comprehensive training on data management and fostering accessibility and responsiveness to user requests.

Richard Vecqueray, CEO of Map of Ag, expressed his enthusiasm for the certification, stating, “At Map of Ag, we firmly believe in the power of transparency and trust when it comes to data governance. We’re proud to be certified under this scheme, demonstrating our unwavering commitment to putting farmers’ interests first and fostering a culture of trust in data management.”

Map of Ag’s certification under the Farm Data Principles scheme reaffirms its dedication to promoting data transparency, security, and integrity within the agricultural sector. By adhering to these principles, Map of Ag aims to facilitate data-driven innovations while prioritising the welfare and empowerment of farmers.

Accuracy essential to measure feed emissions

The use of long-established industry averages to calculate the embedded CO2 emissions of purchased feeds is no longer tenable, as James Husband explains.


Everyone’s talking about emissions these days and for good reason. With agriculture in the spotlight, farms are under increasing pressure to know the carbon footprint of what they produce.

Much of the focus has been on the belching of ruminants (enteric fermentation) and while this is important, data that we have been working on shows that as much as a third of a dairy farm’s emissions relates to the feed that the farm buys in.
The range between systems is significant with low input grass-based units much lower at around 10%. But where a high input herd is using a lot of concentrate feed, the number could be 30% or more.

With retailers and processors having made very public commitments to reaching net zero, they need to know the carbon footprint of the milk they buy, referred to as Scope 3 emissions, because those emissions can represent 75-80% of their total. Scope 3s are, therefore, a big deal.

For some time the industry has relied on average or assumed figures, an approach which treats all feeds in a very generic way – an 18% protein cake is simply that, regardless of the make-up of the constituent parts that contribute to the protein content.

With such a low level of accuracy, some retailers and food businesses invoked blanket bans on the use of soya for example, because it was not possible to establish its provenance and whether its production was associated with land use change which has a very large impact on the embedded emissions number. And yet it is probably not fair to demonise soya in this way because its protein density per area of production is very high, which is a good thing.

All this has led to a need to reassess how the carbon footprint of feeds can be measured. Over the past three to four years we have been working with a number of clients to inject more rigour and robustness into the calculations. The findings have been quite eye-opening.

By plotting the CO2 emissions based on the old methodology of assumed averages and comparing this with the numbers we are now getting (see Figure 1) it’s very clear that those industry averages are simply not good enough. The variability is huge with some concentrate feeds at a standard 18% protein inclusion having embedded emissions more than three times higher than others.

Our approach starts with understanding how much bought-in feed has been used by the farms. Where we have been granted permission by the farmer, we can use the feed orders and deliveries from their feed company to give us this information.

Then we need to know the embedded emissions number (expressed as CO2 equivalents) for all the feeds (concentrates, blends and straights). This is more complex. So we approach it in a number of ways. One is to rely on the embedded CO2 number provided by the feed company. Several of the larger ones have the resources to do this. Another is to be provided with the specification of the cake with the percent inclusion rates to which we apply numbers from the Global Feed LCA Institute (GFLI) database.

Ideally we’d like to know the exact component analysis of the feed but some companies regard this as confidential intellectual property and are unwilling to share it.

In these circumstances, we apply algorithms based on our growing dataset to calculate the emissions based on more limited information such as the percent of soya or palm oil. And we can even back-engineer the analysis based on the statutory information on the feed label (which lists the constituent parts in descending order) knowing that the molasses inclusion rate is usually somewhere around 6%.

Good data, as ever, holds the key. Working with the farmers and their feed companies and building confidence in these important relationships is crucial.

Could things be improved? Yes, of course. A national and independent certification system for feeds would be a great way to enable feed companies to provide very accurate numbers without giving up IP. And on the farm, the use of feed data from farm software systems (for example Feedlync or Keenan’s InTouch) would provide increasing granularity and accuracy, and could provide a much improved level of automation too.

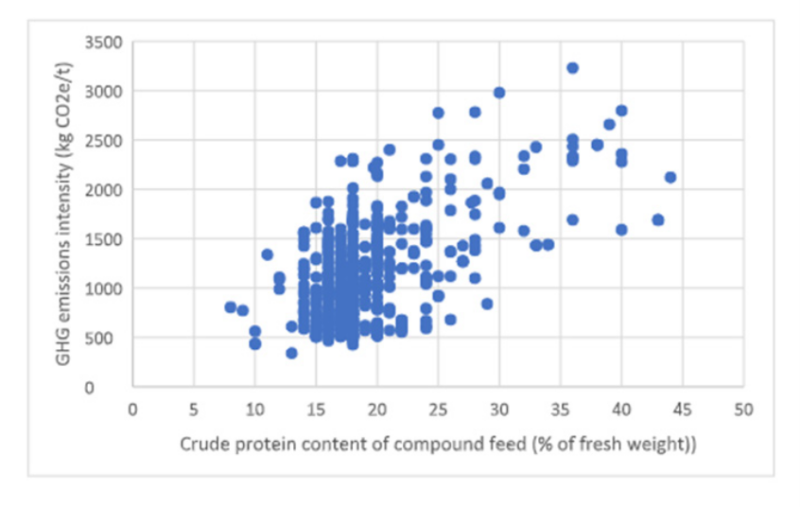
Figure 1: GHG emissions intensity of compound feeds – the detailed analysis shows the variability of individual feeds (blue dots) with similar or the same levels of crude protein content (Source: Map of Ag)

Farm sustainability baselines offer benefits for growers

Sustainability targets set by food and retail companies are driving the need for accurate data and metrics. But it’s not just about meeting corporate needs, as Jim Flambert explains.


Farming is going through a historic shift in focus from all-out production agriculture to environmentally responsible and sustainable practice. For many farms this is a challenging time – and not just because of the input cost squeeze.

The green shoots of this change are being evidenced by a new emphasis among forward-thinking agrifood businesses that have set ambitious and challenging environmental sustainability goals. Inevitably, this has meant these corporates are having to get much closer to their farmer suppliers and understand how those farms operate.

This is not always straightforward. Farmers are, understandably, very protective about their businesses and often see being asked to share information (data) up or down the supply chain as something of an imposition.

But data sharing is going to become the norm. Farming represents approximately 0.5% of GDP in the UK, and yet accounts for 10% of our carbon emissions. Agriculture in the UK (and around the world) is going to need to be much more accountable.

It’s no surprise, therefore, that we are developing an increasing portfolio of those corporate customers who are leading the charge in this space by working proactively with growers. The key here is shared knowledge so that both the agrifood business and the farmer can realise the benefits.

Our approach involves generating a baseline for a farm in terms of its greenhouse gas (GHG) emissions, or sustainability practices (for example regenerative approaches), or biodiversity measures. To do this we ask farmers to complete a survey which can take anything from two to four hours to complete if everything has to be entered manually.

This is not exactly what a hard-pressed farmer wants to hear which is why our focus has been to explore ways to streamline the process by making use of data farmers may already have in other systems.

By linking our survey with a farmer’s farm management records, for example Muddy Boots or Gatekeeper, we can pre-populate it and verify that data so a grower only has to check it through and fill in the gaps. That can save as much as 60-70% of the completion time.

We have also built direct data links to carbon calculator tools, such as Cool Farm Tool, which means the data can be processed automatically and, where needed, reprocessed in the event the tool updates its models and calculations.

This enables us to generate dashboards in our Farm Metrics software for the growers and our agrifood clients. These can range from some headline numbers around emissions factors to nitrogen usage efficiency and farmer benchmarking with anonymised peers through to more detailed metrics around organic and inorganic fertiliser use, pesticide applications, yields, protein or oil content, and measures around biodiversity and practice adoption.

While the initial driver might be to enable a food manufacturer or retailer to have the metrics they need to establish their net zero progress, there are plenty of good reasons why farmers should want to engage and set aside that relatively small amount of time.

First is the simple fact that if you don’t measure it, you can’t manage it. We are seeing a shift away from chasing yield to targeting profitability. But profitability is made up of a number of dynamics from inputs usage and energy consumption to improved farming practices such as increased soil organic matter, tree and hedgerow planting, and sustainable tillage practices which can improve input use efficiency, water retention, and soil health, all of which drive that bottom line. The rise in the regen story is intrinsically linked to GHG emissions and farmers who are doing this well are, quite simply, becoming more profitable.

There are other benefits too such as payment of premiums for crops produced in a certain way, very often the adoption of regenerative farming techniques.

For us, this is not about generating carbon credits, it’s about farming better. The rewards in better efficiencies, coupled with premium payments are, in reality, more tangible and less risky than selling credits in an unregulated and immature market.

We are working on some exciting developments too. Satellite imagery is the next data layer we are starting to use to help verify tillage practices, crop types and areas, on which farmers may be receiving premium payments.

But we do have to be sensitive to the farmer’s realities. Trying to get engagement in the middle of drilling, or a busy spring crop protection campaign is not realistic. And we have to ensure that we are acting responsibly when it comes to the use of their data, providing assurances on where the data will be used, by whom and to what purpose.

The progress is, however, encouraging…and necessary. In years to come we will need to be generating these metrics every year, not just a once-in-five-year snapshot, because the seasonal variability in farming is so great, and because there will be a growing need for higher resolution and increasingly accurate data.

Eventually, we may well need a central database of farm emissions so they can be correctly allocated across the supply chain, to ensure the allocations are fair and representative and avoid double counting. But that’s one for another day.


Read more of our Horizon articles here…

The Sustainable Agriculture Transformation: Insights from The Oxford Farming Conference

The agrifood supply chain is undergoing a fundamental transformation, and nowhere was this more evident than at the recent session between Map of Ag and ADM at The Oxford Farming Conference.

This gathering of minds served as a critical junction for discussing the pressing challenges and transformative strategies shaping the future of farming. The conversation, enriched by insights from ADM’s Jonathan Lane and sustainability expert Hugh Martineau, revealed a collaboration making a major shift towards regenerative practices.

Jonathan Lane, Managing Director of ADM Agriculture, provided a panoramic view of the company’s journey toward sustainable and regenerative agricultural practices. With an emphasis on “utilising the power of nature,” Lane clarified ADM’s dedication to nurturing a food system that is both nutritious and conscientious of its environmental footprint. ADM’s strategy encapsulates a holistic approach, from reducing greenhouse gas emissions to enhancing soil health and protecting water quality. The company’s regenerative program, which ambitiously targets 4 million acres globally, stands testament to its commitment to environmental stewardship.

Lane highlighted the interconnected elements within the agricultural supply chain, emphasising that “carbon emissions across the supply chain are shared by those involved in producing food.” This statement not only underscores the collective responsibility but also the collective opportunity that lies within the grasp of every stakeholder in the farming ecosystem. He brought to light the innovative collaboration with PepsiCo, which champions regenerative farming on an international scale, and discussed the UK’s evolving legislative landscape that continues to redefine the parameters of sustainable agriculture.

Hugh Martineau, Technical Director of Sustainability at Map of Ag, delved deeper into the realm of emissions monitoring. The post-Paris Agreement era has seen a surge in MRV processes, and Martineau spotlighted the need for robust and transparent methodologies. The CoolFarm Tool was singled out for its transparency and adaptability, vital characteristics in the fast-evolving landscape of emissions measurement.

Both speakers tackled the issue of data, recognising its paramount importance in accurately assessing and improving agricultural practices. Martineau noted, “The most important thing we should be really looking at is how we access and utilise activity data from the farm.” This attention to data integrity and permissioning is a cornerstone of Map of Ag’s approach, ensuring that farmers can participate in these programs with confidence.

We cannot help but reflect on the challenges that come with such ambition. Lane addressed the difficulty in engaging farmers and the hurdles presented by the verification process. Yet, there was a sense of optimism as he spoke of the market’s rapid evolution and the growing appetite for sustainability that is reshaping consumer demands.


When listening to the thoughts shared by Lane and Martineau, several thought-provoking themes emerge. The first is the momentum behind regenerative farming practices. This approach to agriculture has the potential to redefine our relationship with the land, shifting from extractive to restorative. The second is the recognition that the path to sustainability is not solitary. It requires a number of stakeholders, each playing their part in harmonising the needs of people, planet, and profit.

The session also presented a challenge to the broader industry, calling stakeholders to rise to the occasion and meet the growing demands for sustainability head-on. It underscored the need for actionable insights, derived from accurate data, to inform better farming practices that can sustainably feed the world without depleting its resources.

The conversation at The Oxford Farming Conference was more than just a dialogue; it was a call to action. As the agricultural sector stands at the crossroads of change, it is imperative that we learn from the insights offered by industry leaders such as ADM and Map of Ag. Their collaboration is paving the way for a future where sustainable farming is not just a niche but the norm.

Whether you are grappling with the challenges of sustainability or eager to implement regenerative practices, Map of Ag stands ready to support your journey towards a more sustainable and resilient food system.

To explore how Map of Ag can support you on your sustainability journey, please visit mapof.ag or contact us on info@mapof.ag for further information.

Horizon 2024

Over the past 12 months it feels like we’ve turned a corner.


There has been talk for many years about the power of data and the way it can revolutionise farming and food production. Yet the talk hasn’t always been matched by the walk. But now it seems the use of data, particularly when it comes to sustainable food production, is becoming a core activity throughout the food chain from the farm to the retailer shelf.

As the articles in this year’s Horizon publication attest, much is being done at a practical and pragmatic level with data, from improving on-farm efficiency through to international marketing. It all proves that with better information at our fingertips, we can and will make better decisions.

But it isn’t easy. Much of the data in our sector is messy and fragmented and the industry is going to need to be able to do these data-driven things at significant scale if we are to realise the opportunities and mitigate the risks of food production.

Within our own business, our Pure Farming data exchange platform is starting to come into its own: enabling us to integrate and tidy up data from disparate sources and then use it intelligently to deliver on-farm measurement and change towards environmental targets such as a reduction in the supply chain’s Scope 3 emissions.

The story in these pages of the Statham family’s cotton farm based in Australia is a fabulous example of data being used in all facets of the business – understanding the opportunity to produce more sustainably, developing technology that can scale, and backing it up with robust and defensible science that is hard to knock. The Stathams are setting a standard for what is possible and in doing so moving their business from one of price taker, to price maker.

That’s a fantastic achievement but it shouldn’t be unique. Their example should be a beacon for others to follow. A demonstration that data should be the friend of the farmer, not something to fear. It’s why we are signing up to the new Farm Data Principles data certification scheme in the UK (you can read more about the scheme at the back of these pages) and have adopted the Australia Farm Data Code, to give farmers reassurance that in our business we are handling data transparently and respectfully.

We hope others will follow and help release the power of digital in our sector. Because the evidence of the past year suggests there is much to gain from independent, credible and trusted use of data throughout the supply chain.

Farmers need to know there are benefits from this. What follows in this year’s Horizon should leave no-one in any doubt…


Harnessing the Power of Spatial Data in Agriculture: In-depth Conversations with Leading AgriTech Experts

Smart farming brings together the elements of technology, sensing and automation, and data analysis to help farmers manage risk, support productivity, and address sustainability. This all relies on being able to make sense of data across time and geography, and in connecting multiple technologies and platforms. To address this need, we brought together a panel of industry specialists for a webinar focused on “A dive into spatial data interoperability”.


Our panel of speakers included Brendan O’Connell, CEO of AgriTech New Zealand, Andrew Cooke, CTO of Map of Ag, and Chloe Walker and Willis Richie from Precision Farming.


The power of industry collaboration

Brendan O’Connell discussed the vital need for pre-competitive collaboration in establishing industry standards. He advocated for creating a unified front by including different stakeholders who may have contrasting perspectives.


“Collaborating with people who may be competitors, who may occupy different parts of the supply chain, or who may have varying levels of interest to collaborate at this specific time, can be challenging. However, it is precisely these differences that present the real opportunity to bring people together and generate impactful results.” – Brendan O’Connell


An open-source approach to specifications

Andrew Cooke led attendees through the process of coordinating a diverse group to create useful specifications without getting caught in a drawn-out standardisation effort.

“We wanted to experiment with an open-source collaboration with a short MVP approach… to maximise reuse, avoid capture by any single organisation… and be globally available.” – Andrew Cooke

The Geospatial working group, with individual and business participants across New Zealand and Australia, made use of existing specifications and standards to avoid reinventing the wheel. The resulting framework provided definitions and a data schema for agricultural and horticultural land-based activities.

A focus on outcomes for farmers

Chloe Walker, COO of Precision Farming, reinforced the importance of delivering benefit to farmers:

“How do we make farm data simple, so farmers can focus on farming better, not paperwork?”

For Precision Farming, this has meant a transition from equipment solutions to a focus on data integration and turning that data into useful outcomes for farmers.

“There’s world-class technology on the market – we just need to make sure its interoperable,” – Chloe Walker.

Precision Farming’s Head of Technology, Willis Ritchie explained how each participant brought the benefit of their experience to the Geospatial working group.

“Before we joined the group, we were working with each data format, and doing what we needed to do… Bringing that experience to the group and saying ‘hey, look, here’s what we learned’ is hugely beneficial, not just for us but for the industry overall.” – Willis Ritchie.

As Precision Farming revises and upgrades its platform, Willis and his team review the open-source specifications, and look at how they can move to use the new framework. With multiple legacy integrations to support, this will be a journey, but the specifications set a clear path for industry to adopt over time.


You can also watch the full webinar recording here

Want to learn more?

To discuss any of these topics further, get in touch with us by emailing info@mapof.ag, or filling in the form below.


Why farm data is essential to understanding agri-food emissions

The action in tackling agricultural emissions is being led by food supply chains and financiers, well ahead of regulators. Benchmarking and mitigating emissions needs to be based on farm-level data, providing proof for claims and tools for producers to make changes.


In the previous post we saw how agri-food companies are making commitments to reduce the emissions embedded in their agricultural supply chains (their “scope 3 emissions”). Before they can reduce the footprint of their value chains, organisations need to understand the size of those emissions, what drives them, and where the levers are to reduce greenhouse gas emissions. Where do they start?


Beginning with industry averages

Many businesses rightly start to understand the intensity of supply chain emissions by using industry averages and applying these in a weighted fashion to their product ingredients. As a “first cut”, this made sense for prioritisation.

But industry averages are insufficient. They don’t necessarily reflect regional variations, or the emissions of a particular supply portfolio. High level scans provide initial information to inspire future research – as the FAO report, Livestock’s Long Shadow, did in 2006 for example. The numbers in that report have been disputed and some claims have since been withdrawn: an example of why broad averages can’t be relied on for product and brand claims.


Finding the right scale

Increasingly, large organisations seek to set and track against their targets and avoid greenwashing through the Science-based Targets initiative (SBTi). To be approved by SBTi, and/or align with the GHG Protocol for scope 3 emissions accounting, a company’s targets and measurement programme needs to prioritise collecting accurate, primary data where emissions are most material.

More granular, farm-level emissions calculations allow companies to identify and address hot-spots in their supply chains, and to understand the levers for, and scale of, economically achievable reductions.

A common way for food brands and retailers to address their scope 3 emissions is through engagement with their supply chain. What this looks like varies. For some, it is the active selection of ingredient blends through a sustainable sourcing process and tool such as AtSource. Others choose to send their supply partners questionnaires using programmes such as SupplyShift Thesis. This approach likely won’t scale appropriately to farmers and growers, so aligned retailer or brand supply programmes, processors, and farmer-led supply groups seek to use farm-level calculations directly.


Which brings us to farm scale data

For most agri-food supply chains, on-farm emissions are material, whether for crops or livestock. Increasingly this means that calculations must use data of sufficient accuracy and granularity, potentially with some level of verification.

Companies could just ask every farmer to fill in a GHG calculator. There are many of these in each country, and companies may choose the tool that provides the most precise calculations for a farm type and region; they may use a country-level approved tool; or they may choose a consistent calculator across their global supply chain.

The challenge becomes one of data entry and collection. Asking farmers to use calculators removes the ability to verify the accuracy of the data used and creates an additional burden for farmers. They may even need to use multiple calculators for different customers or regulations.

Granularity questions come into play as well. We can simplify the calculators (“look, only three boxes!”) but at the cost of less accurate data. This typically forces farmers to do more manual collation and back-of-the-envelope calculations themselves. I see this frequently with apparently simple calculators that force farmers to either undertake manual data collation, or just guess at what the right input might be.

At the same time, having a sustainability consultant or advisor drive up every farm driveway to collect and validate input data also doesn’t scale from prototype to full value-chain.


Integrate, pre-populate, and verify

We’re seeing agri-food companies who are engaging with farmers to address scope 3 emissions taking a more advanced approach. Farm-level data – inventories, crops, inputs, and activities are collated through a platform such as Map of Ag’s Pure Farming and delivered into a questionnaire or calculator for farmers with most of the information prefilled.

Farmers control the flow of that data through permissions, and then review the summarised results to ensure that their farm is fairly represented. Gaps can be filled (for instance, entering electricity usage). Verification is possible because the original granular data was collected from source.

UK cereal maker Weetabix uses just this process with its dedicated Weetabix Growers Group, as part of the “Weetabix Protocol” quality, food safety, and sustainability programme it uses to engage with its growers. Map of Ag’s Technical Director for Sustainability, Hugh Martineau, describes the process:

“We get as much information as we can from their farm management software – if they don’t use software then we can collect it online. This includes all inputs, such as fertiliser, sprays, and field operations, as well as outputs such as wheat yields and quality.”

Using the Cool Farm Tool, the data is processed into a carbon footprint and Nitrogen use efficiency (NUE) figure. The platform shows Weetabix the aggregated and individual results and growers also have visibility of what their total emissions are, their emissions intensity per tonne of wheat produced, and how much nitrogen is transferred into the harvested product.

“Nitrogen is responsible for 70-80% of all greenhouse gas (GHG) emissions from wheat production,” Mr Martineau explains.

Long Clawson, the Leicestershire maker of the famous Stilton cheese, uses an equivalent process with its milk suppliers.

“Around eighty per cent of our emissions come from our farms so if we don’t measure their footprints we just wouldn’t know where to start” says Kim Kettle, Long Clawson’s Farm Liaison Director.

The analysis that Long Clawson produces using Map of Ag’s technology allows Long Clawson and their suppliers to focus on the areas where farmers can make changes to reduce emissions – recognising there is a biological limit to savings that can be made while delivering the product needed.


Could this work for you?

To learn more about how your value chain could leverage farm data, get in touch with us by emailing info@mapof.ag, or filling in the form below.


How agri-food value chains are helping to address farm emissions

Farmers and growers sometimes feel as though they are tackling climate change alone, in the face of governments and international trade barriers. But retailers and food and fibre value chain brands are also highly motivated to address emissions – which brings both support and risks for producers.


Retailers, consumer packaged goods brands, and increasingly banks and investors are making commitments that will reduce their emissions.  Not just their own business emissions (so-called “Scope 1” emissions), and their energy mix (“Scope 2” emissions), but those of their supply chains or financing: “Scope 3” emissions. For food businesses, many of these emissions arise from the farming, growing, and fishing activities that are the ultimate source of our food.

Over the past few years, businesses have lined up their commitments around supply chain emissions. Increasingly, these commitments are also verified under the Science-based Targets initiative (SBTi).

  • In 2021, PepsiCo announced its plans to reduce the absolute GHG emissions across its direct operations (scope 1 and 2 emissions) by 75% by 2030, against a 2015 baseline. By 2030, the company also wants to cut Scope 3 emissions by 40%.
  • Nestlé has set SBTi-approved targets that will reduce emissions 50% by 2030 against business-as-usual (including the scope 3 emissions that make up 94.8% of its emissions). Key focus areas include dairy and livestock, soils, and forests.
  • Mars, the global manufacturer known for petfood and chocolate, has just refreshed its roadmap to net zero by 2050. This includes full value-chain emissions reductions of 50% by 2030 and 80% by 2050. Their planning and analyses include assessing the potential impact of current reduction technologies, and a focus on climate-smart agriculture.
  • In New Zealand, Fonterra’s Cooperative Difference targets for addressing scope 3 emissions will be announced before the end of 2023.

These value chain businesses recognise that they will need to apply a range of strategies to achieve the emissions reduction targets they have set.

Product reformulation is on the list of tactics – reducing the proportion of emissions-heavy ingredients in their products in favour of alternative formulations. Replacing products entirely – for instance, creating a plant-based ice-cream rather than dairy-based is a similar tactic. For producers supplying higher emission ingredients, this may bring a substantial risk.

Land use change is a key part of the value chain toolbox. This certainly includes detecting and removing deforestation activities from their supply chains. Remote sensing tools can be used for this, but they need to be integrated with traceable supply chain systems, so organisations are assessing the land from which product was sourced. Land use change also offers opportunities to take carbon our of farming systems. This might include enhancement of native forests and biodiversity areas or replanting of low-productivity land in trees.

Other initiatives focus on understanding the emissions from individual farm systems. In these initiatives, value-chain companies can support and even invest in R&D with farmers to reduce the emissions intensity of production. Examples include improving production efficiency in beef systems, reducing methane from dairy cows through feed additives, or reducing carbon dioxide emissions from cropping soils through regenerative agriculture practices such as cover crops and low-till cultivation practices.

Assessing these initiatives against science-based targets requires the ability to bring together data from the wide variety of tools and systems that producers use (or sometimes don’t use) on farm. Higher quality and more complete farm data enables reporting to the required standards for SBTi and other protocols and provides agri-food companies and farmers or growers with the information needed to support change.

Surveys and manual data entry are unlikely to provide sufficiently complete and accurate information for these purposes. On-farm data collection by consultants, agronomists, or auditors just won’t scale to cover the number of farms needed by supply chains, especially when data is required annually rather than on an occasional basis. The need for quality data, collated and standardised from source tools used by farmers has driven an increasing number of agri-food businesses to turn to Map of Ag and the Pure Farming SaaS data exchange platform.

Pure Farming allows agri-food businesses to ask farmers for the data they need for Scope 3 emission calculations, and for farmers to decide which data they are willing provide and connect the systems they already use to deliver data without manual rekeying.

If you would like to learn more about how Map of Ag helps agri-food companies quantify their Scope 3 emissions, or to provide feedback and join the conversation, email us at info@mapof.ag or fill in the contact form below.

Innovative Solutions to Tackle Methane Emissions in Dairy Farming

As global concern grows over the environmental impact of dairy farming, experts are working diligently to unravel the complex issue of methane emissions. This issue was the focus of a recent insightful webinar hosted by Eco-Sens and Map of Ag. We invite you to explore the key points raised during the webinar and encourage you to watch the full webinar on our website for more in-depth insights.


Understanding the Methane Challenge

The webinar started with an introduction, setting the scene by Joe Towers, Senior Customer Account Manager at Map of Ag. “Ruminant methane emissions are a significant contributor to scope three emissions related to a dairy farm,” Towers said, highlighting the urgency of finding innovative methods to accurately calculate and mitigate these emissions.


Enteric Methane Monitoring

During the webinar, a groundbreaking equation was presented that can predict the quantity of methane in grams per litre of milk, using the bulk milk fatty acid profile and the cow’s intensity of production. “Middle infrared technology can be used to assess the milk fatty acid profile and this is automatically done on all routine bulk milk samples carried out by NML but is not reported unless you ask for it,” shared James Husband, Senior Livestock Consultant at Map of Ag.

He also emphasised that there is seasonal variation in milk fatty acid profiles which are strongly influenced by the ration the cows are fed and probably related to changes in day length. “The data the equation produces is useful for dairy processors to make informed decisions about how to reduce methane,” Husband added.


The Role of Eco-Sens

Eco-Sens’ patented equation for measuring methane, using bulk milk fatty acids and milk production levels was discussed by Mathieu Tournat, Managing Director at Eco-Sens. “There is no practical way to directly measure methane emissions on farm. Our patented Eco-Sens methodology is cost-effective and simple and has been recognized by UNFCCC, the French Ministry, and the Belgian National Climate Commission,” Tournat announced.

He stressed the importance of acting immediately to scale down methane emissions. He offered practical ways to achieve this, such as diet adjustments and the use of additives. He also pointed out that the effects of some of these methane abatement additives can be assessed using the Eco-Sens equation.


Methane Emissions and Feed Quality

The final section of the webinar focused on how the fatty acid content of the cow’s diet could affect monthly methane emission values. “Grazed grass has a high level of omega 3 fatty acids which affects the fatty acid profile of the milk and when this profile is fed through the Eco-Sens equation it shows a reduction in methane per litre. This effect would not be picked up by the normal input equations that are used for assessing methane,” Husband explained, indicating that omega-3s from grass or external sources from sources such as linseed could be used to construct diets that result in lower methane emissions.


Conclusion

The webinar provided valuable insights into the complexities of methane emissions in dairy farming and showcased innovative approaches to monitor and reduce these emissions. The discussions also emphasised the need for immediate action and the implementation of practical solutions.

We encourage you to watch the full webinar here to delve deeper into these discussions and gain a comprehensive understanding of this critical environmental issue. As the speakers highlighted, every dairy processor keen on making well-informed decisions about reducing methane emissions can’t afford to miss these insightful discussions.


ADM Milling’s UK pilot project maps carbon emissions in its wheat supply chain

ADM, global leader in nutrition, and the leading flour miller in the UK, has for the first time calculated the emissions from the production of wheat in its UK supply chain.


The pilot – undertaken by ADM Milling – is also one of the first led by a major food manufacturing company in the UK to calculate the emissions in the production of wheat, recognising that as climate change intensifies, it is vital for companies to understand the level of emissions produced further up their supply chain and take action to reduce their carbon footprint.


Using Map of Ag as a data collection partner, ADM partnered with around 50 farmers to collect data and calculate the carbon footprint of farms’ wheat production based on approx. 25,000 tonnes of wheat harvested last summer, equating to 20 million 1kg bags of flour milled by ADM – the equivalent of roughly 40 million loaves of bread (of 800g each).


The data from year 1 of the pilot shows that the emissions from the UK famers involved in the study sits at 302 kg/CO2e/t*, well below the previously reported standard values for UK milling wheat, which typically fall around 420 kg/CO2e/t. The next stage of the pilot will involve collecting data from the same group of farmers over the next two wheat harvests to ensure ADM creates a reliable baseline for the company and its customers and to track changes year-to-year.


Nitrogen fertiliser was responsible for the biggest proportion of emissions (on average 75%). However other key sources of emissions included energy use (liquid/gaseous fuel and electricity) and crop residue (the breakdown of crop residues in field by natural processes).


The first set of data gives an early indication of the positive impact of adopting regenerative agricultural practices on reducing farming emissions.

ADM worked with farmers to reinforce the importance of regenerative agriculture methods, these included reduced tillage on the land, growing legumes in rotation to supply nutrients back to the soil, and adding organic fertilisers like manure and digestates.

ADM has made the data available to farmers involved in the study so they can benchmark their carbon footprint against the wider group and has held a feedback session for farmers to discuss group results, explain trends and share insights on how certain regenerative agriculture methods can reduce their carbon footprint.


ADM is also looking to expand the area of milling wheat crops included in the pilot and the number of growers involved – working to support more growers in better understanding the emissions of their crops and taking steps to reduce them.


Jonathan Lane, Managing Director ADM Agriculture said “Farmers are at the centre of what ADM does and their resilience and success is critical to a sustainable food system. This pilot marks another progressive step in ADM’s sustainability journey and long-term commitment to supporting farmers in our supply chain. We want to keep taking steps to help farmers better understand their carbon footprint and reduce their GHG emissions, whilst producing food to feed the world.”


James Daw, a farmer from Warwickshire taking part of the pilot said, “I have farmed my whole life and am deeply committed to looking after the land and environment so it can continue to provide a living for myself and for future generations. 15 years ago I embarked on using regenerative agriculture methods to reduce my footprint and improve the health of my soil – from cover crops, to crop rotation.  Now, I’m really excited to work with ADM, to measure the emissions that come from producing wheat on my farm and better understand what further steps I can take to improve my carbon footprint.”


* This number takes into account peat oxidation risk.

About ADM Milling

ADM serves customers in over 160 countries and established its UK Milling operation in 1999. ADM Milling UK Ltd has a network of wheat flour mills across England, Wales and Scotland. National sales coverage via its own distribution fleet services all sectors of the bakery and food manufacturing sectors.