The use of long-established industry averages to calculate the embedded CO2 emissions of purchased feeds is no longer tenable, as James Husband explains.
Everyone’s talking about emissions these days and for good reason. With agriculture in the spotlight, farms are under increasing pressure to know the carbon footprint of what they produce.
Much of the focus has been on the belching of ruminants (enteric fermentation) and while this is important, data that we have been working on shows that as much as a third of a dairy farm’s emissions relates to the feed that the farm buys in.
The range between systems is significant with low input grass-based units much lower at around 10%. But where a high input herd is using a lot of concentrate feed, the number could be 30% or more.
With retailers and processors having made very public commitments to reaching net zero, they need to know the carbon footprint of the milk they buy, referred to as Scope 3 emissions, because those emissions can represent 75-80% of their total. Scope 3s are, therefore, a big deal.
For some time the industry has relied on average or assumed figures, an approach which treats all feeds in a very generic way – an 18% protein cake is simply that, regardless of the make-up of the constituent parts that contribute to the protein content.
With such a low level of accuracy, some retailers and food businesses invoked blanket bans on the use of soya for example, because it was not possible to establish its provenance and whether its production was associated with land use change which has a very large impact on the embedded emissions number. And yet it is probably not fair to demonise soya in this way because its protein density per area of production is very high, which is a good thing.
All this has led to a need to reassess how the carbon footprint of feeds can be measured. Over the past three to four years we have been working with a number of clients to inject more rigour and robustness into the calculations. The findings have been quite eye-opening.
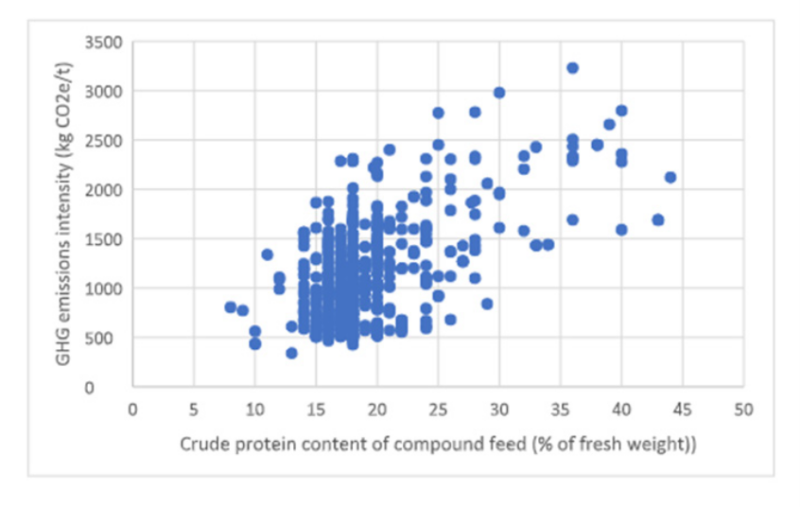
By plotting the CO2 emissions based on the old methodology of assumed averages and comparing this with the numbers we are now getting (see Figure 1) it’s very clear that those industry averages are simply not good enough. The variability is huge with some concentrate feeds at a standard 18% protein inclusion having embedded emissions more than three times higher than others.
Our approach starts with understanding how much bought-in feed has been used by the farms. Where we have been granted permission by the farmer, we can use the feed orders and deliveries from their feed company to give us this information.
Then we need to know the embedded emissions number (expressed as CO2 equivalents) for all the feeds (concentrates, blends and straights). This is more complex. So we approach it in a number of ways. One is to rely on the embedded CO2 number provided by the feed company. Several of the larger ones have the resources to do this. Another is to be provided with the specification of the cake with the percent inclusion rates to which we apply numbers from the Global Feed LCA Institute (GFLI) database.
Ideally we’d like to know the exact component analysis of the feed but some companies regard this as confidential intellectual property and are unwilling to share it.
In these circumstances, we apply algorithms based on our growing dataset to calculate the emissions based on more limited information such as the percent of soya or palm oil. And we can even back-engineer the analysis based on the statutory information on the feed label (which lists the constituent parts in descending order) knowing that the molasses inclusion rate is usually somewhere around 6%.
Good data, as ever, holds the key. Working with the farmers and their feed companies and building confidence in these important relationships is crucial.
Could things be improved? Yes, of course. A national and independent certification system for feeds would be a great way to enable feed companies to provide very accurate numbers without giving up IP. And on the farm, the use of feed data from farm software systems (for example Feedlync or Keenan’s InTouch) would provide increasing granularity and accuracy, and could provide a much improved level of automation too.

Figure 1: GHG emissions intensity of compound feeds – the detailed analysis shows the variability of individual feeds (blue dots) with similar or the same levels of crude protein content (Source: Map of Ag)


